Emissions Solution
Analyze and benchmark global oil and gas emissions
Dive into our granular oil and gas emissions data, analyzing at an operator, country or individual asset level


Asset-level detail
Comprehensive granular emissions data
Dive into 85,000+ assets globally, with ownership and operator tracking, split by details such as emission source and greenhouse gas
Full value chain view
Carbon and methane scopes 1-3 coverage
Analyze historic and forecasted point source, physical trade flow, and end-use combustion emissions
Data harmonization
Harmonized data across reporting standards and boundary definitions
Evaluate at the same detail across companies, geographies and emission sources, with harmonized reporting schemes, views and boundary definitions
By the numbers
85,000+
Upstream Assets
3,200+
Companies
1,000+
Refineries
100+
Liquefaction Plants


Emissions benchmarking
Benchmark your priorities at a click of a button
Benchmark companies, sectors, geographies, emission sources and more to understand carbon intensities of your selected peer group across scopes 1-3.


Trade flow emissions tracking
Reveal the true carbon intensity of your commodities
Understand well-to-tank emissions of traded oil and gas volumes globally, in a shifting regulatory landscape. Prepare for EUMR, CBAM and other policy developments ahead of the curve.

Methane satellite integration
From methane plume detection to asset-level attribution
Sentinel-2/5 satellite imagery is captured multiple times per week, processed against Rystad Energy's global facility database to attribute methane plumes to individual upstream assets.
Use our approach to contextualise methane plumes and tie them back to responsible parties, measuring and understanding your related portfolio risk.


Case Study
From academic estimates to ground truth: how Rystad Energy is helping shape global LNG emissions policy
Challenge
SEA-LNG needed defensible, asset-level well-to-tank emissions data to support regulatory advocacy at the IMO; replacing estimates built on academic literature with analysis that could withstand technical scrutiny
Our Solution
Rystad Energy combined shipping and bunkering data, global LNG trade flow tracking, and cargo-level emissions profiles across the full value chain, from liquefaction to delivery, in a single integrated study
Results
SEA-LNG used Rystad Energy's vessel-level emissions tracking and LNG trade flow data to produce a landmark white paper, the findings of which were submitted to the International Maritime Organization and endorsed by Norway and South Korea.
"This landmark report sets new standards for well-to-tank emissions analysis, providing the rigorous, data-driven foundation that policymakers and industry need to make informed decisions on LNG as a marine fuel."
- SEA-LNG
See how our platform drives performance in your industry

Energy companies
Utilize our Emissions solution to:
- Benchmark your emissions against selected peers
- Contextualize your methane emissions
- Outline emission profiles for transation support
- Understand decarbonization trends across the industry
The next-generation market intelligence platform
Spektra
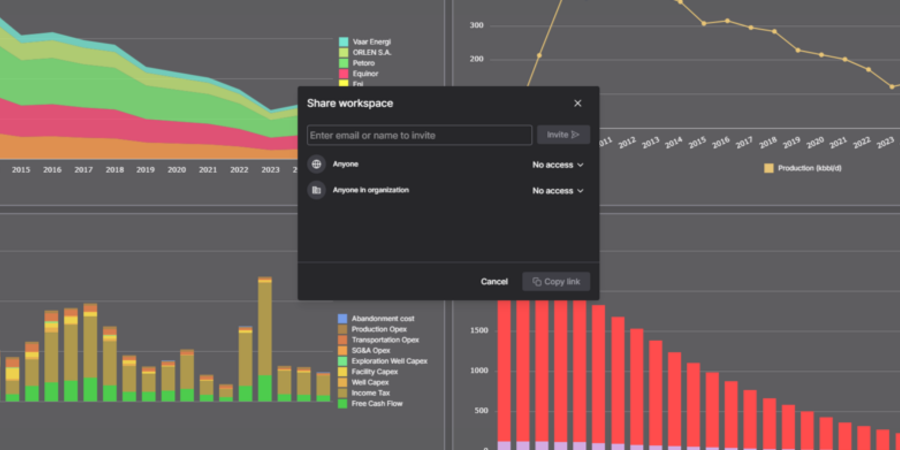
Collaborative workspaces
- Easy sharing via link to workspace
- Centralized collaboration
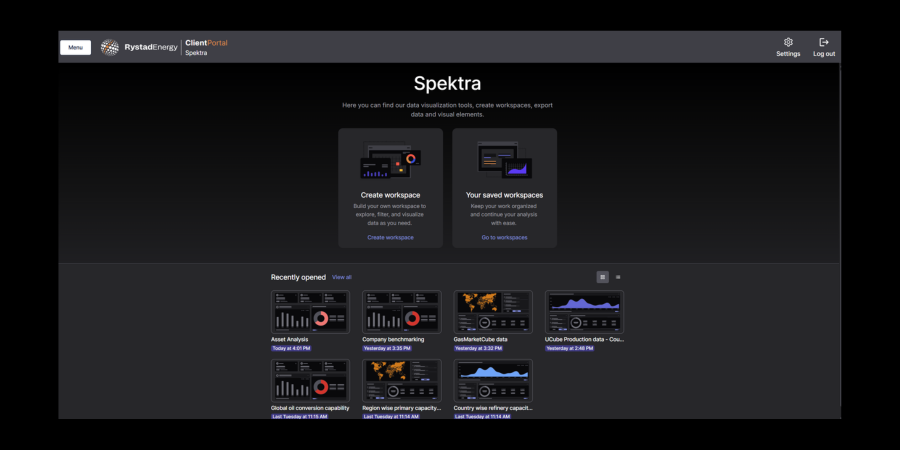
Fast, reliable and flexible access
- Instant data processing
- Spektra integrates with Copilot, ChatGPT, Claude and any other compatible AI Agent or Large Language Model via the Model Context Protocol (MCP)
- Access Rystad Energy data through web-based workspaces, MCP connectors or an API gateway in the way that works best for your workflows
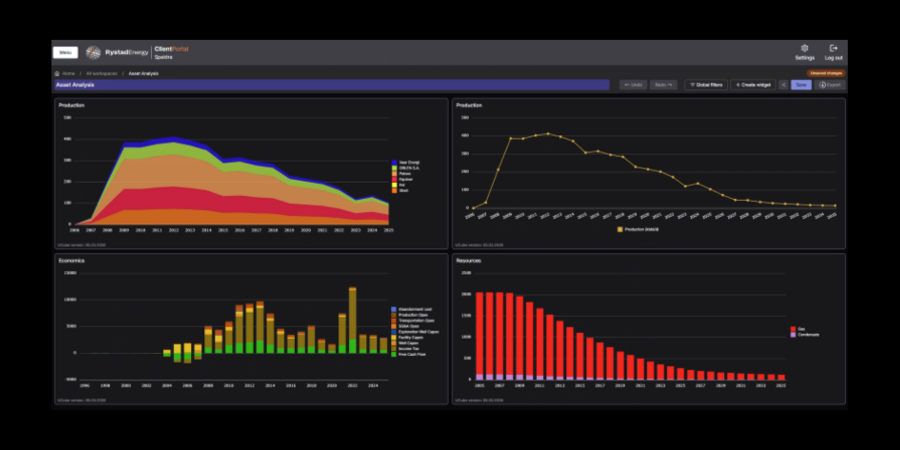
Granular, multi-level analysis
- “Micro to macro” data granularity covering the entire energy system and the advantage of a modern AI-native platform
- AskRystad/LLM based front end
- Work across multiple Cubes in parallel
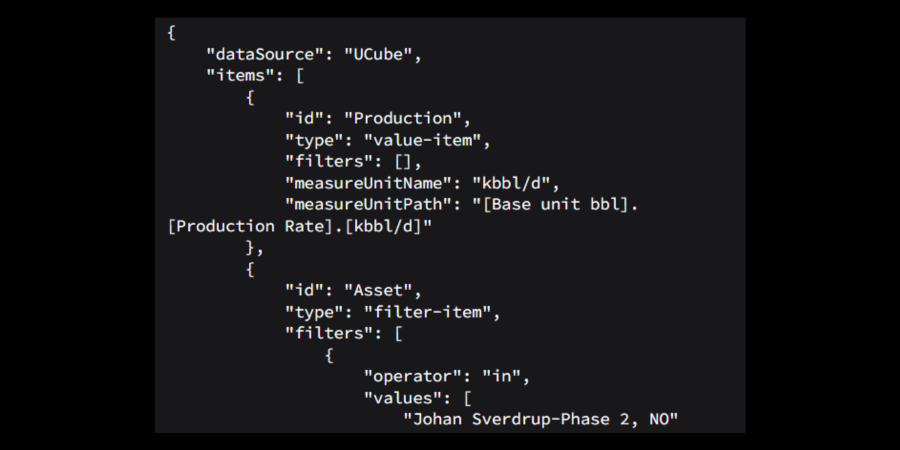
Most advanced MCP connectors and API gateway
- Spektra connects directly to your existing tools and workflows via advanced API and MCP connectors
- Allowing programmatic access to Rystad Energy data
Analyze and compare emissions performance at different levels, individual fields, entire company portfolios, or other groupings, using both historical data and future forecasts
- Dive into 85,000+ assets globally, with ownership and operator tracking, split by details like emission source and GHG
- Analyze historic and forecast point source, physical trade flow, and end-use combustion emissions
- Evaluate at the same detail across companies, geographies and emission sources, with harmonized reporting schemes, views and boundary definitions
Bespoke consulting engagements delivered by our industry specialists
- Shaping strategy
- Transaction support
- Navigating market and policy shifts
- Strengthening business models across portfolios
- Advanced modelling
The Rystad Energy Institute offers personalized courses designed to give individuals and organizations a complete 360° view of the energy market, covering the full energy system across industries, technologies, and regions.
- Elevate your energy IQ
- Stay ahead of the curve
- Drive career growth
Our Carbon & Scenarios portfolio suite
Navigate the energy transition and make informed decisions with our solutions.

