Trading Signals & Macro Trends
Exclusive insights - Stay ahead of the market


Crafted by experts


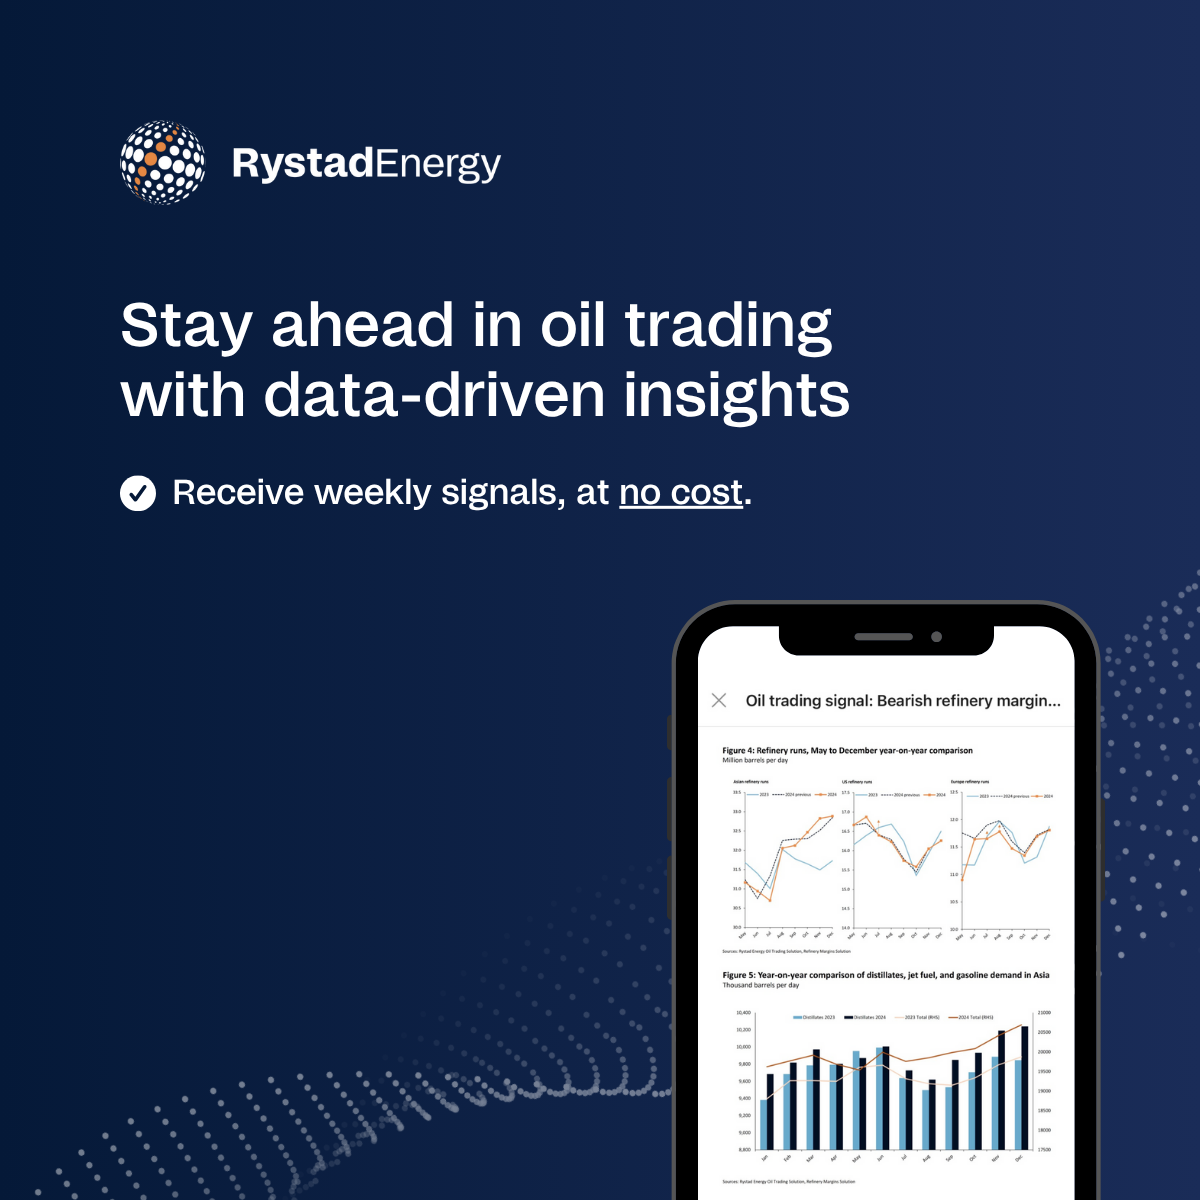
Receive weekly oil trading insights
We publish a wide range of trading insights each week for our clients. This is your chance to receive a curated sneak peek.
Delivered straight to your inbox, our signals draw on high-frequency, short-term data. They cover oil supply, demand, real-time consumption, downstream refining and OPEC+ decisions.
Stay ahead of market shifts. Subscribe today.
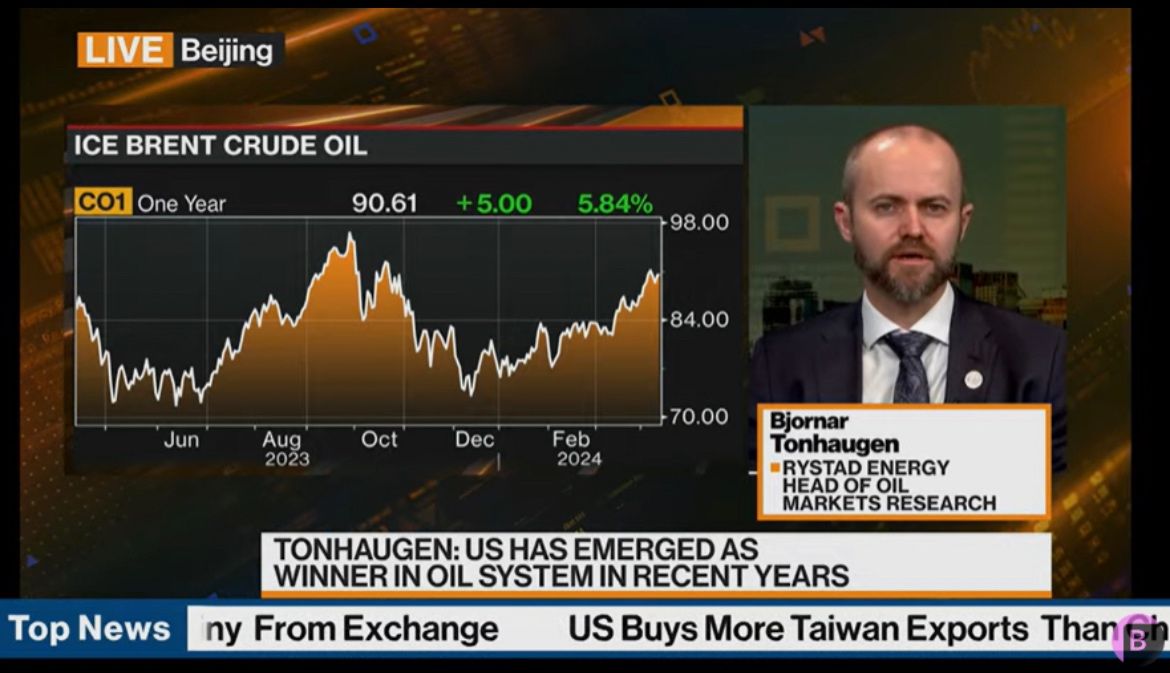
Features in the media


Loading form...